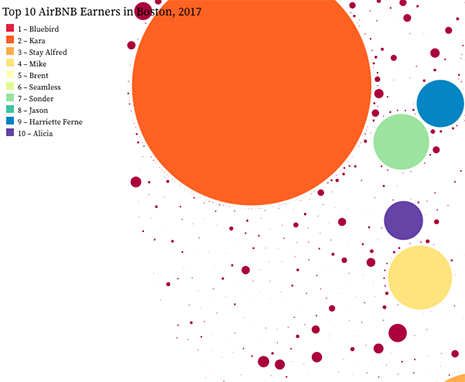
Extreme Inequality in Boston's Airbnb Markets
Uses: JavaScript, D3, R
I collaborated with my classmates to create this visualization showing how a new law about short-term rentals changed Boston's Airbnb market. We used R to analyze the data and JavaScript to create the graph.