What Seattleites read during the pandemic
Uses: JavaScript, HTML, CSS, RStudio, Datawrapper
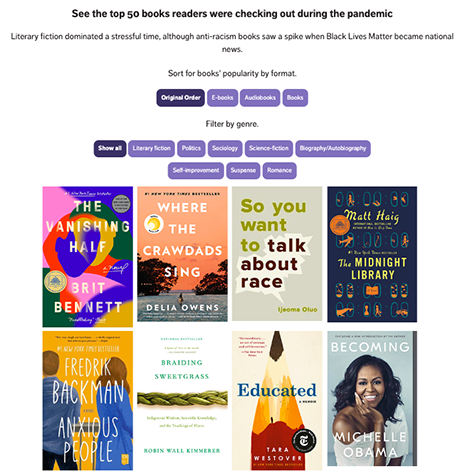
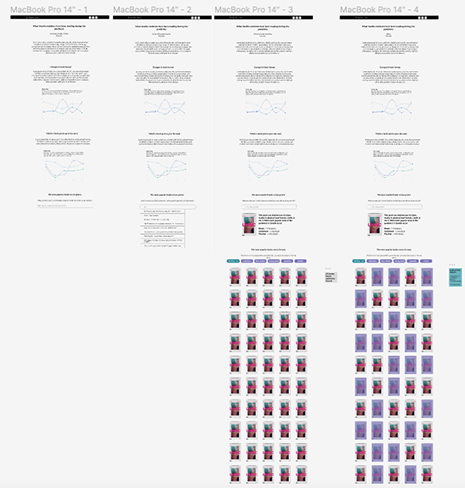
I analyzed a database of Seattle Public Library checkouts to find out what book genres, mediums and titles were the most popular during the pandemic. I created a filterable and sortable table of the 50 most popular books during the pandemic in Seattle, and I used Datawrapper to make charts about the shifts in book genres and mediums.
